I made an air quality sensor
Amidst the Summer of Funemployment in 2019, I put together an air quality sensor to try and quantify my concern about whether the warehouse ceiling was shedding concrete dust into my lungs.
The sensor measures the amount of airborne dust (particulate matter) and breaks its measurement into three categories: particles smaller than 1um, particles smaller than 2.5um, and particles smaller than 10um. The last two are often referred to as PM2.5 and PM10.)
I put this sensor up about six months ago and have been collecting air quality data from inside my house since then. I’ll go over the design of my particular sensor and then pull out a few highlights from the measurements I’ve taken.
Why?
Why care about particulate matter pollution? I don’t usually need a good reason to start measuring things, but it turns out there are many good reasons to be aware of PM2.5 levels. There are a surprisingly wide range of physical health effects linked to particulate matter exposure, from serious to subtle. Air pollution (both indoor and outdoor) contributes to nearly 1 in 10 deaths globally.
At the community level, increases in daily PM levels are tied to higher mortality, and lower PM levels reduce hospitalizations and deaths. When a 13-month strike at a steel mill in Utah lowered the daily average PM10 levels by about 75 µg/m³, pediatric hospital admissions were lowered by about 60%. Following up with individuals living in six American cities over about a decade showed that the residents of the dirtiest city had their life expectancy reduced by about two years compared to the cleanest city.
The negative physical health consequences of PM pollution are surprising in magnitude, but I was even more surprised by the possible linkages between PM pollution and cognition. This blog post from Patrick Collision has a great collection of relevant research, showing that small changes (~10 µg/m³) in PM2.5 levels can have significant effects on cognitive performance.
Design
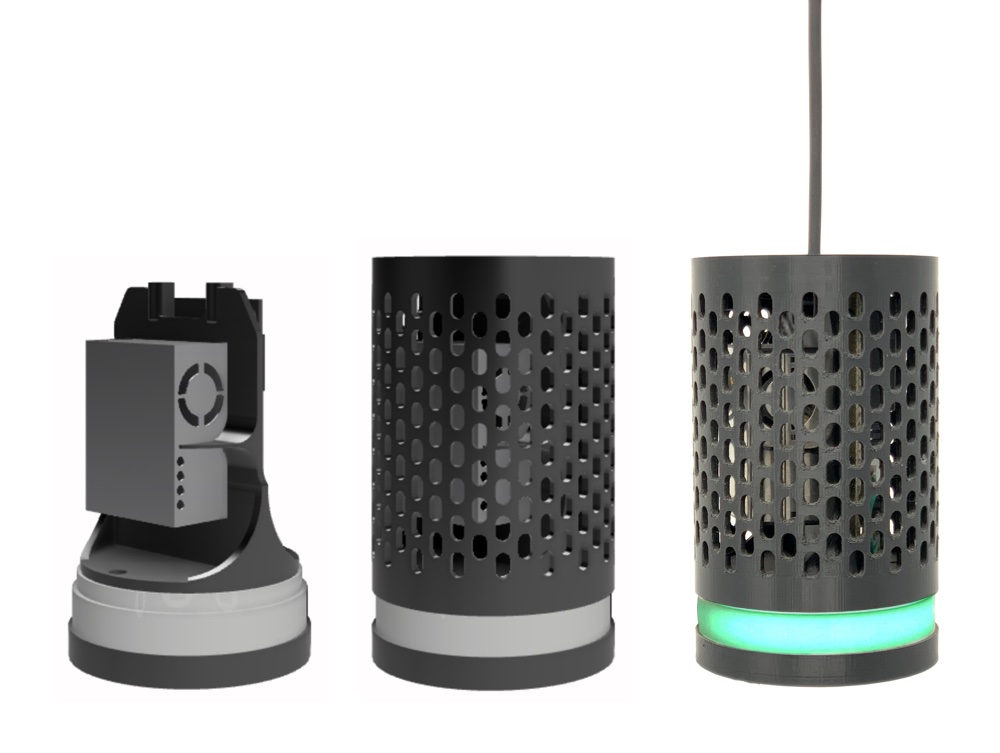
I wanted this to be a little bit nicer than the typical pile of wires and circuits that are taped to surfaces around my house, so I designed an enclosure to go with the electronics.
 Render, render, real
When I designed the housing, I imagined it being able to hang from a cord or sit on somebody’s desk as a personal monitor. The idea was that there would be a second power port at the bottom of the device, so you could plug it in when it was sitting on your desk without having the cable sprout out of the top of the thing.
I ended up only making one prototype of this design (instead of the 3 I originally thought I’d make), so I didn’t really test desk mode extensively. This housing doesn’t have the bottom power port.
I think I’ve been affected by the plethora of fabric-clad cylindrical tech products lately, but I like the way the housing came out. The oval holes come out fine on my 3D printer without support material (which would have to be poked/pulled out of every hole by hand).
In practice, I like the “indicator ring” much better than a single status LED. Right now, sitting at my desk about 25 feet from the sensor without my glasses on, the indicator light on the USB charger in the adjacent outlet is too blurred to see, but I can still clearly read the ring on the sensor as a green light. The sensor hangs a couple feet away from the surface of the column, so you can see it from most angles.
Construction
This thing is all hacked together out of perfboard. I printed a carrier for the electronics that fits inside the housing:
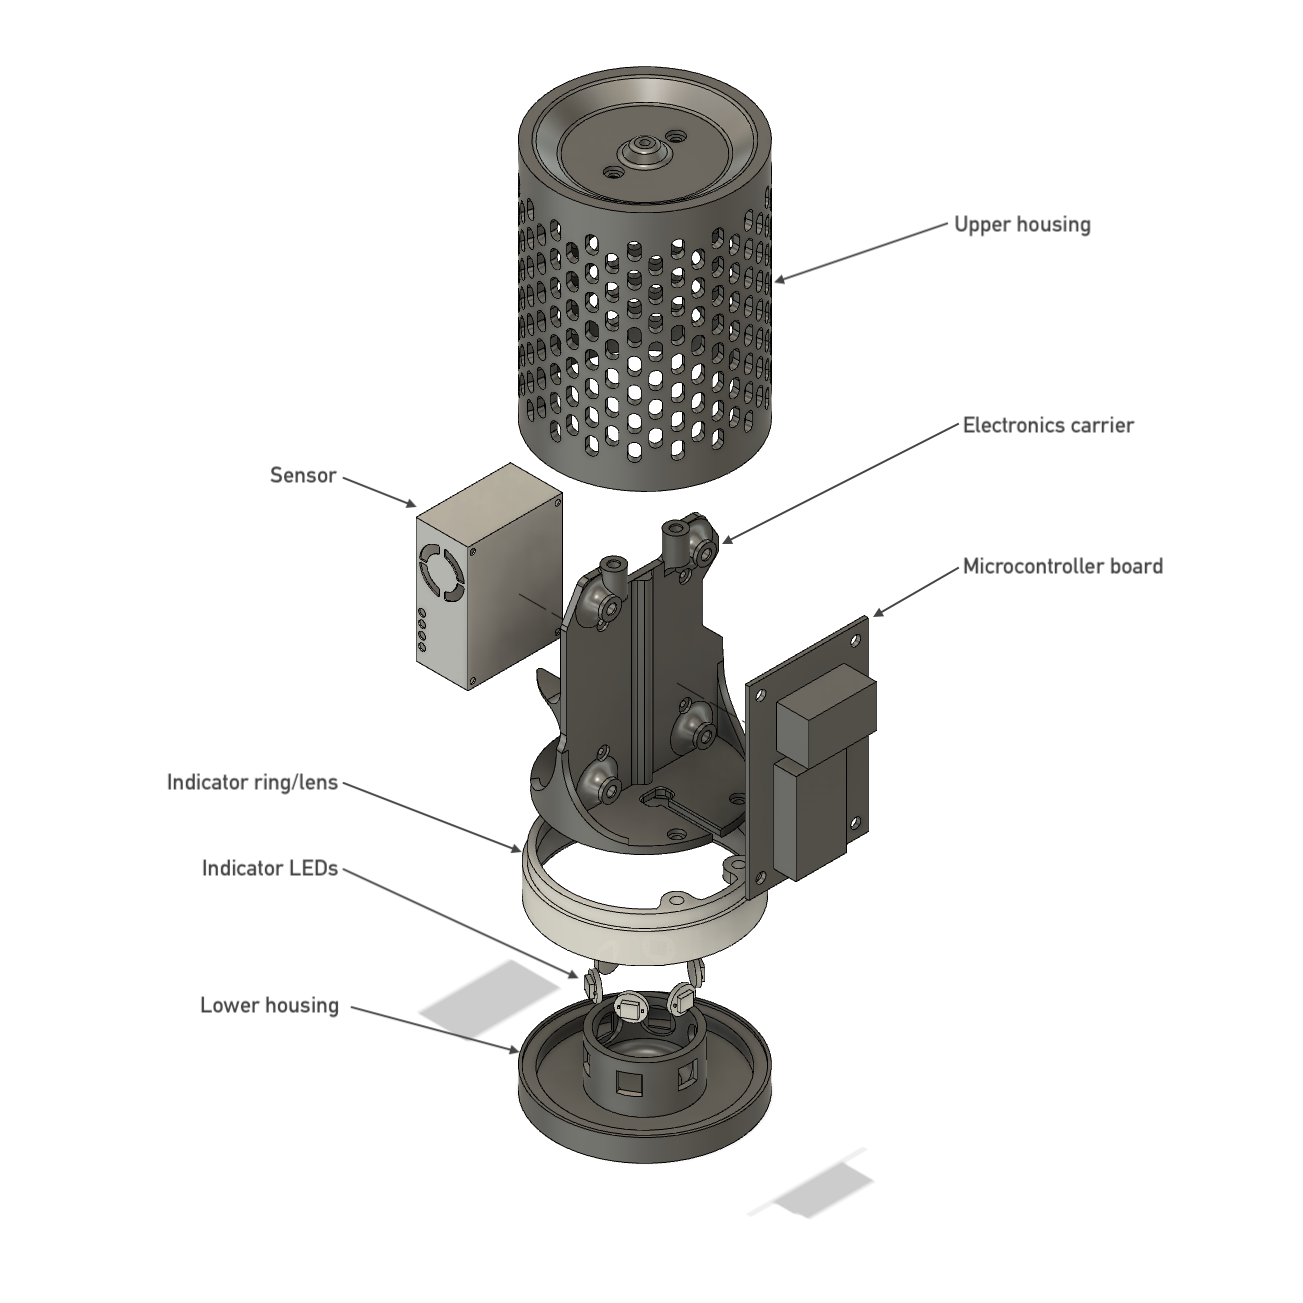 Caption: An exploded view of the sensor assembly. All of the non-electronic parts are 3D printed.
Putting this together didn’t require too many connections, so I assembled the perfboard bits ad-hoc on the bench with an eye towards compactness. When the electronics were working, I just measured what I’d made and made a carrier with mounting holes in the right places.
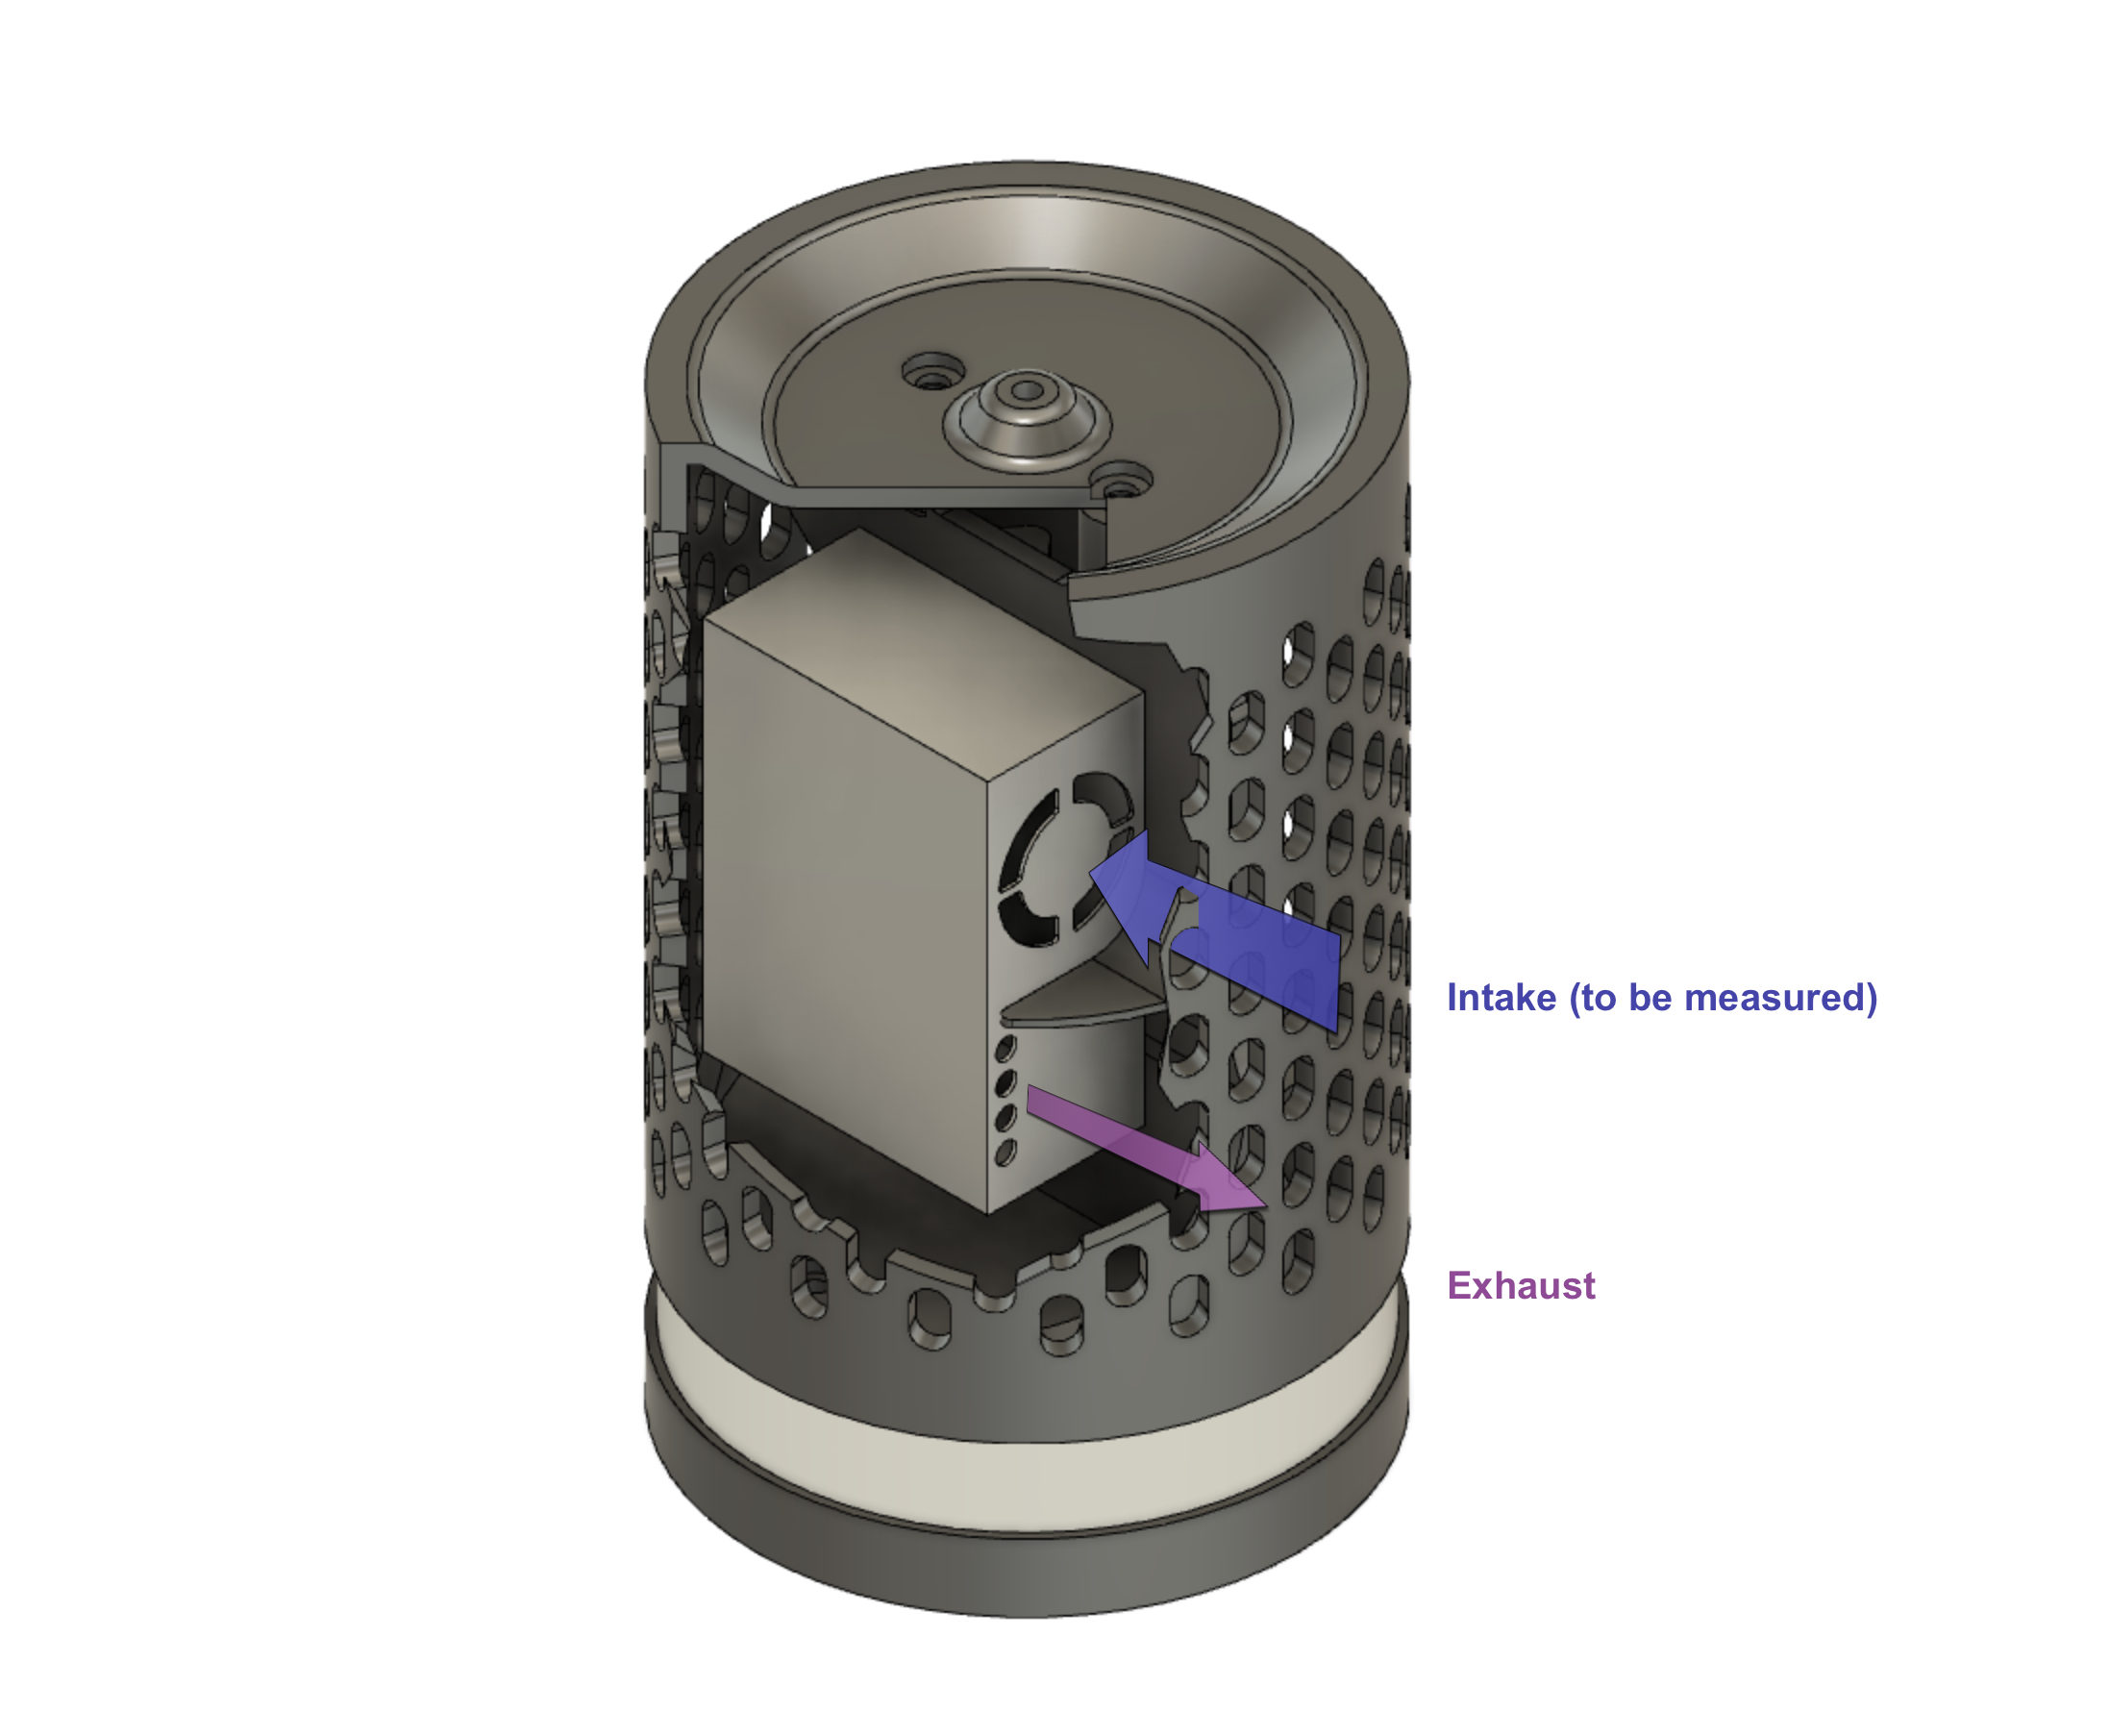
Airflow
The sensor has a tiny little internal fan that draws air in, and it exhausts it out of the four circular ports on the same side.
I added this little airwall in the carrier to try and keep air from recirculating, but I have no idea if it's effective at all.
Indicator ring
The indicator ring is another printed part with six RGB LEDs mounted inside. I’m pleased with how the lens came out. It’s got a concave internal face, to try and get the light to fade slightly at the top and the bottom of the ring, but I don’t really think you can tell in person.
I was excited to play with OSH Park’s flexible PCB fabrication service, so the idea was to print a single flex PCB that had all six LEDs on it, wrapped around a mounting surface in the bottom, and terminated in a plug that could connect directly to the main board. I never got around to doing this, although I still am excited about it.
A few different states of the indicator. Yellow and green indicate air quality measurements in a certain range. The ring spins blue on top of whatever color is displayed when it’s trying to connect to the network.
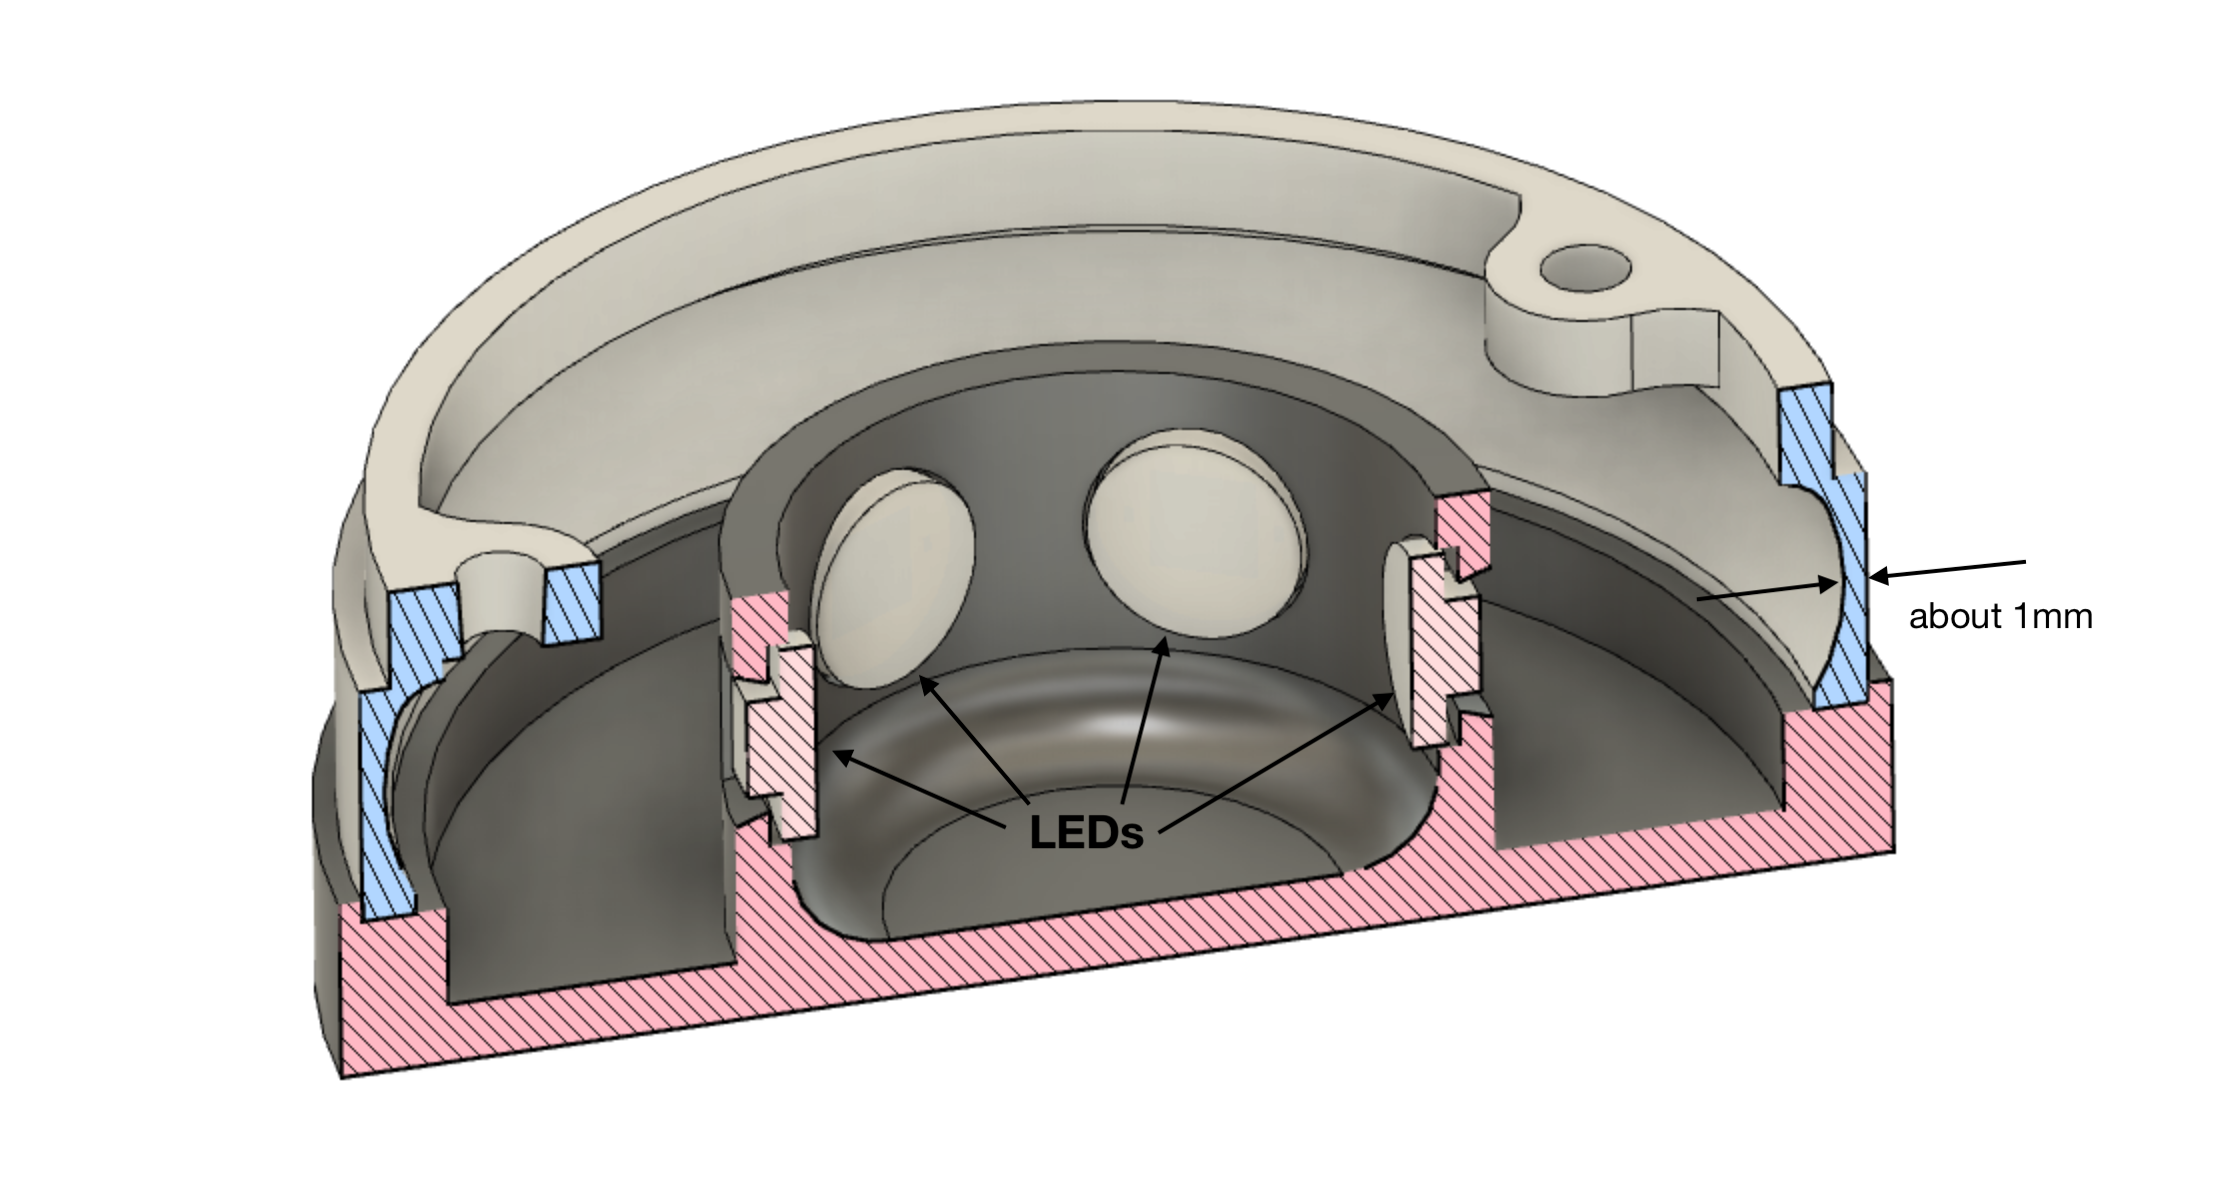 A section view of the LED indicator ring. You can see the lens is thinnest in the center - whether that has any discernible effect is up for debate.
For the prototype here, I just hacked together six discrete RGB LED boards with hookup wire, and it works OK. I printed an assembly jig for the LEDs that holds them at the same spacing as the wire distance between the LEDs when they’re installed in the sensor. This was a nice idea, but I still put them together pretty sloppy.
Sensor
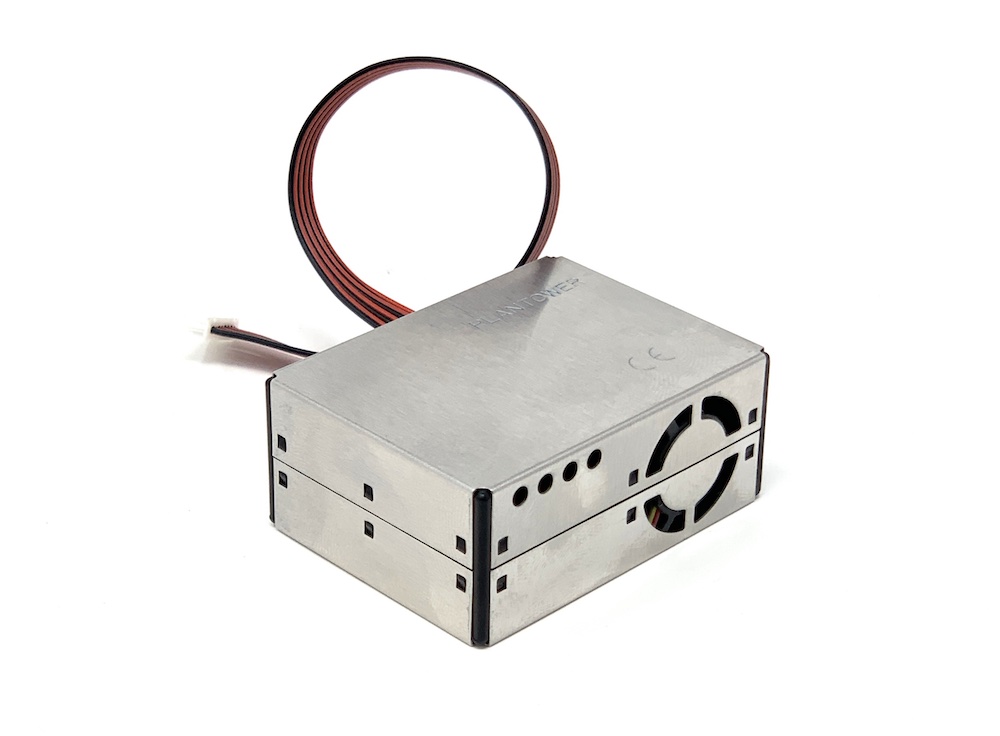
I used a PMS5003 sensor as the heart of this thing - it is cheap ($15 shipped on AliExpress), has good community support (there are tutorials on SparkFun and Adafruit, and open-source libraries for reading its output), and reasonably compact. It looks a lot like a clone of Honeywell’s HPM series PM sensors.
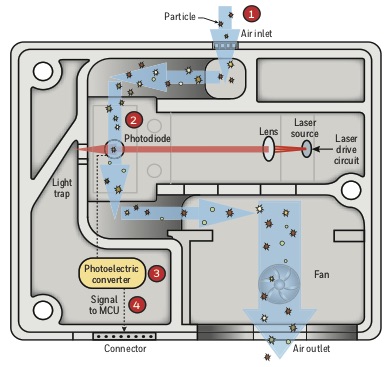
This diagram lifted from the Honeywell HPM datasheet without permission.
The PMS500x sensors are laser-diffraction sensors: they shine a laser through the outside air that’s been sucked into the sample chamber by the built-in fan. Particles get hit by the laser and scatter the beam, and larger particles scatter the beam differently from smaller particles, so a sensor on the other side of the sample chamber can measure the scattered laser light and estimate the quantity and size distribution of the particles in the air.
These particular sensors are certainly not calibrated or anything, and I don’t know a good way to calibrate them or obtain an accurate reference sample with the equipment I have here. When I do get more of these online, I plan to do a consistency test by leaving several sensors running side-by-side and comparing their measurements - but that test only measures the relative accuracy (from sensor to sensor), not the absolute accuracy (the “true” number of particles in the air). Good enough for the time being.
Microcontroller
This is the first or second project I built on the Particle Photon and Particle’s Device Cloud. I was very into the idea of a platform that takes care of network connectivity, device flashing/updates, and cloud messaging in an integrated way. Particle’s stuff is fun to use, but since this project I’ve discovered ESPHome, and it’s been life-changing.
This project works fine with the Particle software - but the firmware still hangs up occasionally when it loses wireless connectivity, requiring a power cycle to fix. I haven’t dug into this too much, but I expect it’s some dumb bug of my own making.
The easy fun way to program the Particle devices is to use their in-browser IDE to write “sketches”, Arduino-style, with a main loop function. They provide you a “Device OS” API to manage system functions like wireless link and power states. This OS provides some RTOS-like task functionality, where you can define independent tasks that run periodically, and the OS handles multitasking and executing the right task at the right time. Great - but when I was building my Particle projects, I was underwhelmed by the maturity of this multitasking functionality. Obviously I’ve overlooked something writing the firmare for these things.
Usage
I hung the sensor from a column in the center of the warehouse at the end of July 2019. It has been online since then with minimal downtime.
The sensor transmits its measurements every so often over MQTT. My home automation server, running Home Assistant, has a sensor configured to represent the physical sensor, and the HomeAssistant sensor’s values are set by the MQTT messages.
There is no offline-sensor detection built in here, which is something I’d rather have - I occasionally find that the sensor has been offline for half a day without my noticing. The measurement data is lost in this case.
Results
In general, the sensor has been an interesting and useful addition to the house - having real-time feedback in the form of the LED ring makes it clear exactly which activities are generating significant quantities of dust.
A typical day’s measurements.
The original question this sensor was supposed to answer was: is the inside of the warehouse shedding abnormal or dangerous amount of concrete dust? The answer is pretty clearly “no”: in general, the interior PM measurements track the outside air quality for any given day, except when we are doing something that is generating fine particles.
Here’s a neat example: in November 2019 I installed an air filter in our space. It’s basically just a 4” pleated filter with a blower fan behind it that’s running constantly. We can see the filter getting darker as it collects dust, but is it really making a difference in the air quality?
95th-percentile PM2.5 concentrations in our indoor air vs. time of day. The data comes from sensor measurements taken between July 2019 and April 2020, split into “before installation” and “after installation”, and bucketed into 5-minute intervals. The filled area behind each trace is ±1 stdev.
Here’s a plot showing the typical PM2.5 in the indoor air over the course of a day, before and after I installed the air filter. My hypothesis is that the filter doesn’t do much to reduce the peak concentrations, but does reduce the PM content much more quickly when the source is removed. In the plot, you can see that the high-end values aren’t much different in the “before” and “after” traces, but the “before” trace never dips below ~22 µg/m³, and the “after” trace sits around 10 µg/m³ during the least-active parts of the day.
Next up
I planned to build several of these units for around the house, but after inspecting the data from this one for a while, I realized that I wanted more sensors: at a minimum, temperature and humidity, but also some fancier measurements (CO and CO2 detection, VOCs, etc).
The upgraded version is still in development - hopefully I’ll finish it this year. I’m always tempted to make a small production run of these things and sell them to folks, but I don’t really know if many people would want one if it doesn’t come with a polished phone app, and I don’t have the time to build that app.
Anyway, stay tuned!
More reading
If you’re hungry for more content, here are some of my bookmarks over the course of building this:
- Health Effects of Particulate Air Pollution - Douglas W. Dockery, Annals of Epidemiology, 2009 - very readable summary of the evolution of the public-health understanding of PM2.5
- Air Pollution and Public Health in Utah - Utah Department of Health, Bureau of Epidemiology - as the title suggests, Utah-specific in some places, but including a good outline of the PM2.5 problem
- The Impact of Indoor Climate on Human Cognition: Evidence from Chess Tournaments - Steffen Künn, Juan Paladins, Nico Pestel, conference paper - “We find that an increase of 10 μg/m3 raises the probability of making a [chess game] error by 1.5 percentage points, and increases the magnitude of the errors by 9.4%.”
- Pollution - Patrick Collision - a personal blog post with links to several other studies like the one above
- Table of Historical Particulate Matter (PM) National Ambient Air Quality Standards (NAAQS) - US Environmental Protection Agency - this was very useful to me when I was trying to decide what levels the color thresholds should be set at
- Air Quality Guidelines - Global Update 2005 - World Health Organization, 2005 - an exhaustively cited overview, nearly 500 pages long, of the sources of, human exposure to, health effects of, impact of, and risks of air pollution